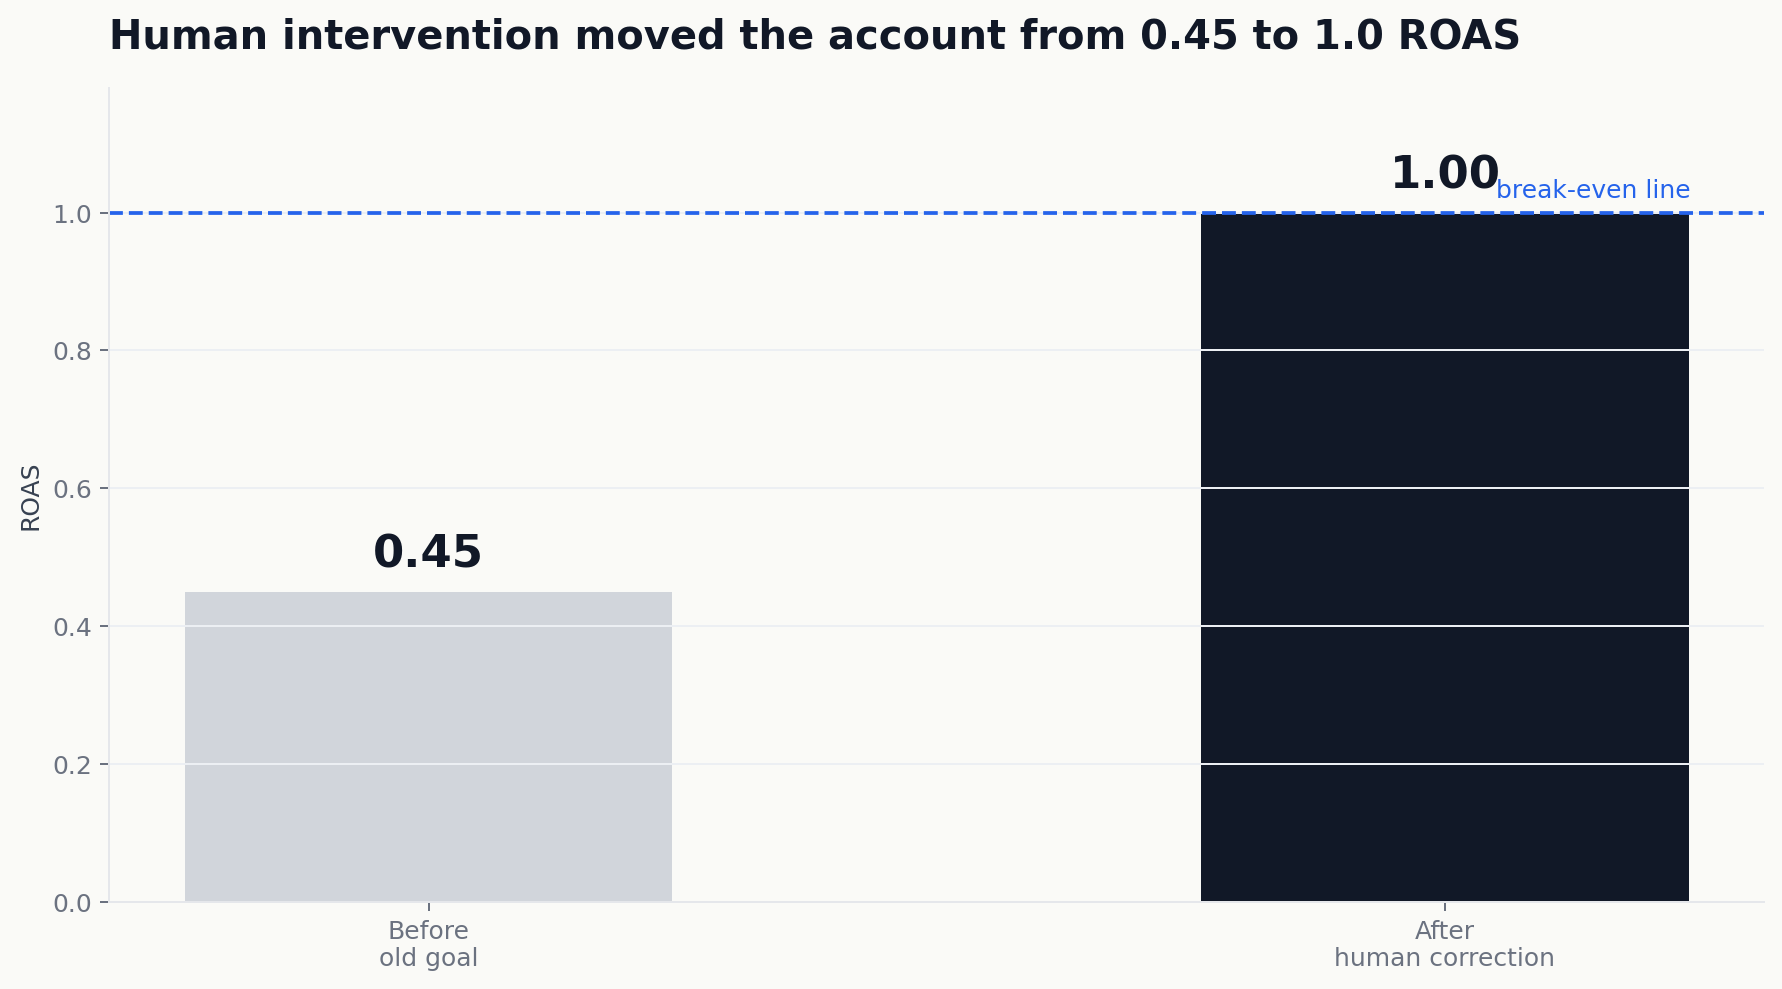
The account did not look broken. That was the problem.
A DTC brand selling home fitness accessories had been scaling Meta spend for eight weeks. The dashboard showed blended ROAS of 1.7. CPA sat at $28. The numbers were not spectacular, but they were consistent. No alarms anywhere.
Then someone pulled a marginal efficiency view.
The last 20% of monthly spend — roughly $3,000 — returned a marginal ROAS of 0.6. Every additional dollar after the first $12,000 was destroying value. The blended average of 1.7 had been hiding a two-week deterioration the dashboard never surfaced.
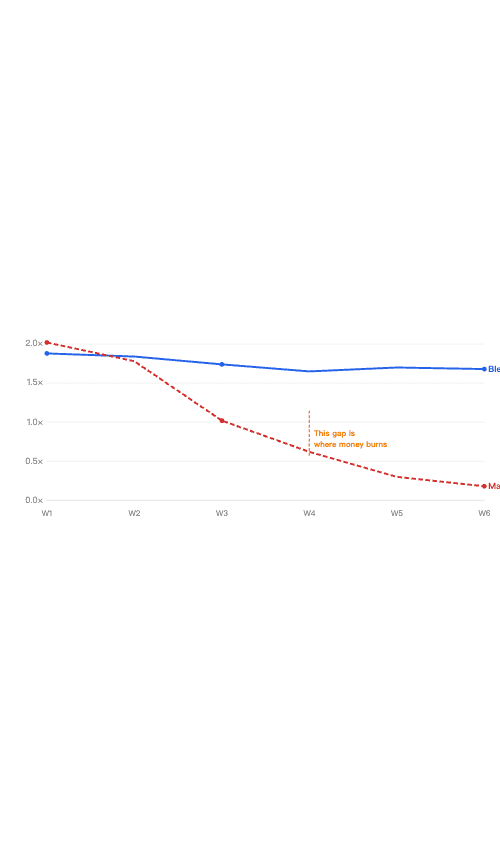
Blended vs. Marginal ROAS — same account, different story
The first $12,000 was doing the job. The last $3,000 was spending like fresh demand still existed, but the audience had been tapped out two weeks earlier. Facebook kept serving the ads because the pixel kept firing conversions — mostly from customers who would have bought anyway.
Saturation was invisible on the standard dashboard.
Why blended metrics hide the problem, every time
This is not a Meta issue. It is a math issue that affects every channel.
Blended metrics are a weighted average. When your early spend bands perform well, the average stays comfortable long after the marginal band goes negative. The blended number only falls once the underperforming portion grows large enough to pull the average down. By then, you have been losing money for a while.
The pattern plays out the same way every time.
Week one. Saturation begins at the top of the spend curve. Marginal ROAS slips from 2.3 to 1.6. Blended ROAS barely moves — 1.9 to 1.8. Not enough to trigger a review.
Week two. Marginal ROAS hits 0.6. Blended ROAS is still 1.7. Still "fine." No alert fires. No budget shifts.
Week three. Someone finally checks the weekly CPA trend, notices it crept from $26 to $32, runs a manual pull, and discovers the last $100 per day has been underwater for three weeks.
By then, $2,000 to $4,000 in avoidable spend is already gone. Every scaling account hits this pattern. The only variable is how long it takes to notice.
The detection gap — saturation begins long before anyone sees it

The platforms automate inside their walls. No one asks the cross-channel question.
Meta's Advantage+ distributes budget across ad sets based on predicted performance. Google's automated bidding adjusts in real time using auction-time signals. Google Marketing Live 2026 pushed more AI into campaign creation and creative generation.
These tools make spending easier. They do not make it easier to know when to stop spending in a channel.
Advantage+ will happily reallocate $100 from a tired ad set to a slightly less tired one and call it optimization. Blended metrics might even tick up from 1.7 to 1.8. But neither algorithm — not Meta's, not Google's — asks whether the channel as a whole has passed its next useful dollar.
That question needs an independent layer.
What a budget watchdog actually checks
A budget watchdog does not touch money. It never pauses campaigns or reallocates budgets without permission. It watches three things. Continuously.
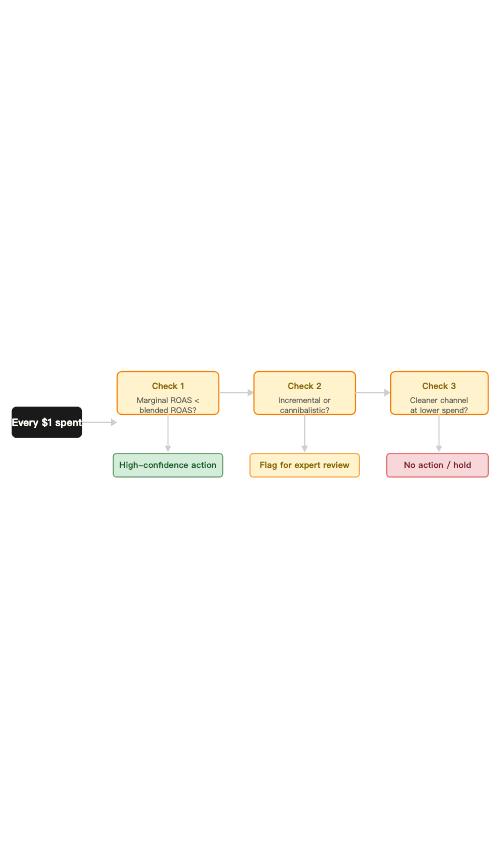
First: marginal efficiency. Is the last spend band underperforming the account average? When the first $12,000 returns 1.8 and the next $3,000 returns 0.6, a watchdog flags the divergence on day one. Not day twenty-one.
Second: incrementality risk. Is the channel paying for demand that would have converted anyway? Brand search is the classic case. A customer types the brand name into Google, clicks the top ad, buys. The campaign claims the conversion. A watchdog does not pretend to measure incrementality perfectly — that is not possible from attribution data alone. It flags the risk so a human evaluates it.
Third: channel opportunity cost. Is another channel showing cleaner signals at a smaller spend level?
Channel comparison — same account, different marginal stories
Channel          | Daily Spend | Blended ROAS | Last 20% Marginal ROAS
Meta             | $500        | 1.7           | 0.6 ↓
Google Shopping  | $200        | 1.3           | 1.5 ↑
TikTok Spark Ads | $100        | 0.9           | 1.2 ↑
This table is the one most teams never build. Meta looks like the winner — blended ROAS is 1.7. But Meta's marginal is falling while Google Shopping and TikTok are improving at the margin. The dashboard says keep scaling Meta. Marginal analysis says move budget to Google Shopping and TikTok.
The threshold stack that makes this actionable
Generic alerts that fire every time a number twitches are useless. What works is a threshold stack that matches how operators actually manage money.
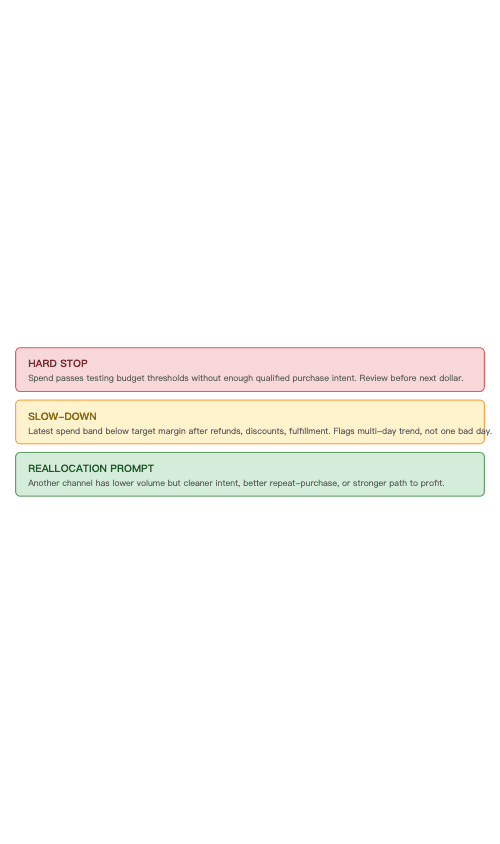
Hard stop. Cumulative channel spend passes the agreed testing budget without enough qualified purchase intent. The watchdog asks for a review before the next dollar goes in. For that DTC brand, this might trigger at $15,000 when marginal ROAS drops below 1.0 for five consecutive days.
Slow-down. The latest spend band falls below target margin after accounting for refunds, discounts, and fulfillment. The watchdog flags the multi-day trend. It does not scream at one bad Tuesday.
Reallocation prompt. Another channel shows lower volume but cleaner intent, better repeat-purchase potential, or a stronger path to profit. The same $100 per day Meta is burning on exhausted audiences might generate cleaner conversions on Google Shopping or a TikTok creator test.
None of this requires the system to know the business better than the operator. It requires the system to watch more consistently than any human can — and to surface the right comparison at the right time.
Most teams catch channel saturation two to three weeks late. Not because they lack analysts or data. Because the data that reveals saturation — marginal efficiency, incrementality risk, cross-channel comparison — lives beneath a blended average the dashboard refreshes every 24 hours.
Auxora is building a supervised agent that solves this.
The agent reads channel data continuously. It detects when the current path is weakening. It surfaces the tradeoff with numbers: "Meta marginal ROAS is 0.6. Google Shopping has fewer orders but cleaner intent. A $500 test is worth running." It asks for approval before any budget shift. It never moves money without permission.
For a DTC operator, this means three things. Earlier detection — marginal deterioration surfaces within days, not weeks. Structured decisions — channel tradeoffs arrive with numbers, not gut feel. Independent oversight — the watchdog works across Meta, Google, TikTok, and email, inside no single platform.
That independence is the hard part. Platforms optimize for their own inventory. A cross-channel supervisor needs access to merchant data across every platform — while respecting privacy constraints, comparing signals without exposing raw data.
This is where AI plus expert judgment plus privacy-preserving collective learning becomes the real engine. The AI handles the continuous watching. The expert handles the judgment calls: when to override, when to wait, when to trust the numbers. The privacy-preserving learning layer lets saturation patterns from one merchant sharpen detection sensitivity for others without ever exposing individual data.
Over time, the watchdog gets smarter without getting more invasive. Detection lag shrinks. Budget moves when it should, not three weeks late.
Media buying will keep automating. Google and Meta will keep pushing AI deeper into campaign management. The gap that stays open is the one neither platform can close: whether this channel should get the next dollar at all. That gap needs an independent agent — one that works for the merchant, watches across channels, catches saturation before it becomes a postmortem, and never touches money without permission.
That is the agent we are building.
Discover your new growth opportunity → auxora.ai/signup